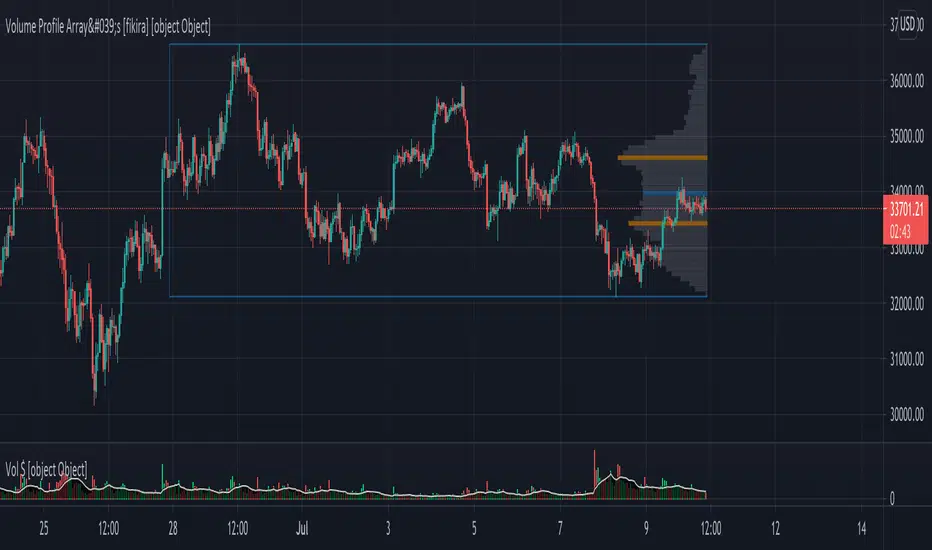
Delta Volume Profile [BigBeluga]🔵Delta Volume Profile
A dynamic volume analysis tool that builds two separate horizontal profiles: one for bullish candles and one for bearish candles. This indicator helps traders identify the true balance of buying vs. selling volume across price levels, highlighting points of control (POCs), delta dominance, and hidden volume clusters with remarkable precision.
🔵 KEY FEATURES
Split Volume Profiles (Bull vs. Bear):
The indicator separates volume based on candle direction:
If close > open , the candle’s volume is added to the bullish profile (positive volume).
If close < open , it contributes to the bearish profile (negative volume).
ATR-Based Binning:
The price range over the selected lookback is split into bins using ATR(200) as the bin height.
Each bin accumulates both bull and bear volumes to form the dual-sided profile.
Bull and Bear Volume Bars:
Bullish volumes are shown as right-facing bars on the right side, colored with a bullish gradient.
Bearish volumes appear as left-facing bars on the left side, shaded with a bearish gradient.
Each bar includes a volume label (e.g., +12.45K or -9.33K) to show exact volume at that price level.
Points of Control (POC) Highlighting:
The bin with the highest bullish volume is marked with a border in POC+ color (default: blue).
The bin with the highest bearish volume is marked with a POC− color (default: orange).
Total Volume Density Map:
A neutral gray background box is plotted behind candles showing the total volume (bull + bear) per bin.
This reveals high-interest price zones regardless of direction.
Delta and Total Volume Summary:
A Delta label appears at the top, showing net % difference between bull and bear volume.
A Total label at the bottom shows total accumulated volume across all bins.
🔵 HOW IT WORKS
The indicator captures all candles within the lookback period .
It calculates the price range and splits it into bins using ATR for adaptive resolution.
For each candle:
If price intersects a bin and close > open , volume is added to the positive profile .
If close < open , volume is added to the negative profile .
The result is two side-by-side histograms at each price level—one for buyers, one for sellers.
The bin with the highest value on each side is visually emphasized using POC highlight colors.
At the end, the script calculates:
Delta: Total % difference between bull and bear volumes.
Total: Sum of all volumes in the lookback window.
🔵 USAGE
Volume Imbalance Zones: Identify price levels where buyers or sellers were clearly dominant.
Fade or Follow Volume Clusters: Use POC+ or POC− levels for reaction trades or breakouts.
Delta Strength Filtering: Strong delta values (> ±20%) suggest momentum or exhaustion setups.
Volume-Based Anchoring: Use profile levels to mark hidden support/resistance and execution zones.
🔵 CONCLUSION
Delta Volume Profile offers a unique advantage in market reading by separating buyer and seller activity into two visual layers. This allows traders to not only spot where volume was high, but also who was more aggressive. Whether you’re analyzing trend continuations, reversals, or absorption levels, this indicator gives you the transparency needed to trade with confidence.
"volume profile"に関するスクリプトを検索
Advanced Volume Profile Pro Delta + POC + VAH/VAL# Advanced Volume Profile Pro - Delta + POC + VAH/VAL Analysis System
## WHAT THIS SCRIPT DOES
This script creates a comprehensive volume profile analysis system that combines traditional volume-at-price distribution with delta volume calculations, Point of Control (POC) identification, and Value Area (VAH/VAL) analysis. Unlike standard volume indicators that show only total volume over time, this script analyzes volume distribution across price levels and estimates buying vs selling pressure using multiple calculation methods to provide deeper market structure insights.
## WHY THIS COMBINATION IS ORIGINAL AND USEFUL
**The Problem Solved:** Traditional volume indicators show when volume occurs but not where price finds acceptance or rejection. Standalone volume profiles lack directional bias information, while basic delta calculations don't provide structural context. Traders need to understand both volume distribution AND directional sentiment at key price levels.
**The Solution:** This script implements an integrated approach that:
- Maps volume distribution across price levels using configurable row density
- Estimates delta (buying vs selling pressure) using three different methodologies
- Identifies Point of Control (highest volume price level) for key support/resistance
- Calculates Value Area boundaries where 70% of volume traded
- Provides real-time alerts for key level interactions and volume imbalances
**Unique Features:**
1. **Developing POC Visualization**: Real-time tracking of Point of Control migration throughout the session via blue dotted trail, revealing institutional accumulation/distribution patterns before they complete
2. **Multi-Method Delta Calculation**: Price Action-based, Bid/Ask estimation, and Cumulative methods for different market conditions
3. **Adaptive Timeframe System**: Auto-adjusts calculation parameters based on chart timeframe for optimal performance
4. **Flexible Profile Types**: N Bars Back (precise control), Days Back (calendar-based), and Session-based analysis modes
5. **Advanced Imbalance Detection**: Identifies and highlights significant buying/selling imbalances with configurable thresholds
6. **Comprehensive Alert System**: Monitors POC touches, Value Area entry/exit, and major volume imbalances
## HOW THE SCRIPT WORKS TECHNICALLY
### Core Volume Profile Methodology:
**1. Price Level Distribution:**
- Divides price range into user-defined rows (10-50 configurable)
- Calculates row height: `(Highest Price - Lowest Price) / Number of Rows`
- Distributes each bar's volume across price levels it touched proportionally
**2. Delta Volume Calculation Methods:**
**Price Action Method:**
```
Price Range = High - Low
Buy Pressure = (Close - Low) / Price Range
Sell Pressure = (High - Close) / Price Range
Buy Volume = Total Volume × Buy Pressure
Sell Volume = Total Volume × Sell Pressure
Delta = Buy Volume - Sell Volume
```
**Bid/Ask Estimation Method:**
```
Average Price = (High + Low + Close) / 3
Buy Volume = Close > Average ? Volume × 0.6 : Volume × 0.4
Sell Volume = Total Volume - Buy Volume
```
**Cumulative Method:**
```
Buy Volume = Close > Open ? Volume : Volume × 0.3
Sell Volume = Close ≤ Open ? Volume : Volume × 0.3
```
**3. Point of Control (POC) Identification:**
- Scans all price levels to find maximum volume concentration
- POC represents the price level with highest trading activity
- Acts as significant support/resistance level
- **Developing POC Feature**: Tracks POC evolution in real-time via blue dotted trail, showing how institutional interest migrates throughout the session. Upward POC migration indicates accumulation patterns, downward migration suggests distribution, providing early trend signals before price confirmation.
**4. Value Area Calculation:**
- Starts from POC and expands up/down to encompass 70% of total volume
- VAH (Value Area High): Upper boundary of value area
- VAL (Value Area Low): Lower boundary of value area
- Expansion algorithm prioritizes direction with higher volume
**5. Adaptive Range Selection:**
Based on profile type and timeframe optimization:
- **N Bars Back**: Fixed lookback period with performance optimization (20-500 bars)
- **Days Back**: Calendar-based analysis with automatic timeframe adjustment (1-365 days)
- **Session**: Current trading session or custom session times
### Performance Optimization Features:
- **Sampling Algorithm**: Reduces calculation load on large datasets while maintaining accuracy
- **Memory Management**: Clears previous drawings to prevent performance degradation
- **Safety Constraints**: Prevents excessive memory usage with configurable limits
## HOW TO USE THIS SCRIPT
### Initial Setup:
1. **Profile Configuration**: Select profile type based on trading style:
- N Bars Back: Precise control over data range
- Days Back: Intuitive calendar-based analysis
- Session: Real-time session development
2. **Row Density**: Set number of rows (30 default) - more rows = higher resolution, slower performance
3. **Delta Method**: Choose calculation method based on market type:
- Price Action: Best for trending markets
- Bid/Ask Estimate: Good for ranging markets
- Cumulative: Smoothed approach for volatile markets
4. **Visual Settings**: Configure colors, position (left/right), and display options
### Reading the Profile:
**Volume Bars:**
- **Length**: Represents relative volume at that price level
- **Color**: Green = net buying pressure, Red = net selling pressure
- **Intensity**: Darker colors indicate volume imbalances above threshold
**Key Levels:**
- **POC (Blue Line)**: Highest volume price - major support/resistance
- **VAH (Purple Dashed)**: Value Area High - upper boundary of fair value
- **VAL (Orange Dashed)**: Value Area Low - lower boundary of fair value
- **Value Area Fill**: Shaded region showing main trading range
**Developing POC Trail:**
- **Blue Dotted Lines**: Show real-time POC evolution throughout the session
- **Migration Patterns**: Upward trail indicates bullish accumulation, downward trail suggests bearish distribution
- **Early Signals**: POC movement often precedes price movement, providing advance warning of institutional activity
- **Institutional Footprints**: Reveals where smart money concentrated volume before final POC establishment
### Trading Applications:
**Support/Resistance Analysis:**
- POC acts as magnetic price level - expect reactions
- VAH/VAL provide intermediate support/resistance levels
- Profile edges show areas of low volume acceptance
**Developing POC Analysis:**
- **Upward Migration**: POC moving higher = institutional accumulation, bullish bias
- **Downward Migration**: POC moving lower = institutional distribution, bearish bias
- **Stable POC**: Tight clustering = balanced market, range-bound conditions
- **Early Trend Detection**: POC direction change often precedes price breakouts
**Entry Strategies:**
- Buy at VAL with POC as target (in uptrends)
- Sell at VAH with POC as target (in downtrends)
- Breakout plays above/below profile extremes
**Volume Imbalance Trading:**
- Strong buying imbalance (>60% threshold) suggests continued upward pressure
- Strong selling imbalance suggests continued downward pressure
- Imbalances near key levels provide high-probability setups
**Multi-Timeframe Context:**
- Use higher timeframe profiles for major levels
- Lower timeframe profiles for precise entries
- Session profiles for intraday trading structure
## SCRIPT SETTINGS EXPLANATION
### Volume Profile Settings:
- **Profile Type**: Determines data range for calculation
- N Bars Back: Exact number of bars (20-500 range)
- Days Back: Calendar days with timeframe adaptation (1-365 days)
- Session: Trading session-based (intraday focus)
- **Number of Rows**: Profile resolution (10-50 range)
- **Profile Width**: Visual width as chart percentage (10-50%)
- **Value Area %**: Volume percentage for VA calculation (50-90%, 70% standard)
- **Auto-Adjust**: Automatically optimizes for different timeframes
### Delta Volume Settings:
- **Show Delta Volume**: Enable/disable delta calculations
- **Delta Calculation Method**: Choose methodology based on market conditions
- **Highlight Imbalances**: Visual emphasis for significant volume imbalances
- **Imbalance Threshold**: Percentage for imbalance detection (50-90%)
### Session Settings:
- **Session Type**: Daily, Weekly, Monthly, or Custom periods
- **Custom Session Time**: Define specific trading hours
- **Previous Sessions**: Number of historical sessions to display
### Days Back Settings:
- **Lookback Days**: Number of calendar days to analyze (1-365)
- **Automatic Calculation**: Script automatically converts days to bars based on timeframe:
- Intraday: Accounts for 6.5 trading hours per day
- Daily: 1 bar per day
- Weekly/Monthly: Proportional adjustment
### N Bars Back Settings:
- **Lookback Bars**: Exact number of bars to analyze (20-500)
- **Precise Control**: Best for systematic analysis and backtesting
### Visual Customization:
- **Colors**: Bullish (green), Bearish (red), and level colors
- **Profile Position**: Left or Right side of chart
- **Profile Offset**: Distance from current price action
- **Labels**: Show/hide level labels and values
- **Smooth Profile Bars**: Enhanced visual appearance
### Alert Configuration:
- **POC Touch**: Alerts when price interacts with Point of Control
- **VA Entry/Exit**: Alerts for Value Area boundary interactions
- **Major Imbalance**: Alerts for significant volume imbalances
## VISUAL FEATURES
### Profile Display:
- **Horizontal Bars**: Volume distribution across price levels
- **Color Coding**: Delta-based coloring for directional bias
- **Smooth Rendering**: Optional smoothing for cleaner appearance
- **Transparency**: Configurable opacity for chart readability
### Level Lines:
- **POC**: Solid blue line with optional label
- **VAH/VAL**: Dashed colored lines with value displays
- **Extension**: Lines extend across relevant time periods
- **Value Area Fill**: Optional shaded region between VAH/VAL
### Information Table:
- **Current Values**: Real-time POC, VAH, VAL prices
- **VA Range**: Value Area width calculation
- **Positioning**: Multiple table positions available
- **Text Sizing**: Adjustable for different screen sizes
## IMPORTANT USAGE NOTES
**Realistic Expectations:**
- Volume profile analysis provides structural context, not trading signals
- Delta calculations are estimations based on price action, not actual order flow
- Past volume distribution does not guarantee future price behavior
- Combine with other analysis methods for comprehensive market view
**Best Practices:**
- Use appropriate profile types for your trading style:
- Day Trading: Session or Days Back (1-5 days)
- Swing Trading: Days Back (10-30 days) or N Bars Back
- Position Trading: Days Back (60-180 days)
- Consider market context (trending vs ranging conditions)
- Verify key levels with additional technical analysis
- Monitor profile development for changing market structure
**Performance Considerations:**
- Higher row counts increase calculation complexity
- Large lookback periods may affect chart performance
- Auto-adjust feature optimizes for most use cases
- Consider using session profiles for intraday efficiency
**Limitations:**
- Delta calculations are estimations, not actual transaction data
- Profile accuracy depends on available price/volume history
- Effectiveness varies across different instruments and market conditions
- Requires understanding of volume profile concepts for optimal use
**Data Requirements:**
- Requires volume data for accurate calculations
- Works best on liquid instruments with consistent volume
- May be less effective on very low volume or exotic instruments
This script serves as a comprehensive volume analysis tool for traders who need detailed market structure information with integrated directional bias analysis and real-time POC development tracking for informed trading decisions.
Extreme Zone Volume ProfileExtreme Zone Volume Profile (EZVP)
Originality & Innovation
The Extreme Zone Volume Profile (EZVP) revolutionizes traditional volume profile analysis by applying statistical zone classification to volume distribution. Unlike standard volume profiles that display raw volume data, EZVP segments the price range into statistically meaningful zones based on percentile thresholds, allowing traders to instantly identify where volume concentration suggests strong support/resistance versus areas of potential breakout.
Technical Methodology
Core Algorithm:
Distributes volume across user-defined bins (20-200) over a lookback period
Calculates volume-weighted price levels for each bin
Applies percentile-based zone classification to the price range (not volume ranking)
Zone B (extreme zones): Outer percentile tails representing potential rejection areas
Zone A (significant zones): Secondary percentile bands indicating strong interest levels
Center Zone: Bulk trading range where most price discovery occurs
Mathematical Foundation:
The script uses price-range percentiles rather than volume percentiles. If the total price range is divided into 100%, Zone B captures the extreme price tails (default 2.5% each end ≈ 2 standard deviations), Zone A captures the next significant bands (default 14% each ≈ 1 standard deviation), leaving the center for normal distribution trading.
Key Calculations:
POC (Point of Control): Price level with maximum volume accumulation
Volume-weighted mean price: Total volume × price / total volume
Median price: Geometric center of the price range
Rightward-projected bars: Volume bars extend forward from current time to avoid historical chart clutter
Trading Applications
Zone Interpretation:
Zone B (Red/Green): Extreme price levels where volume suggests strong rejection potential. Price reaching these zones often indicates overextension and possible reversal points.
Zone A (Orange/Teal): Significant support/resistance areas with substantial volume interest. These levels often act as intermediate targets or consolidation zones.
Center (Gray): Fair value area where most trading occurs. Price tends to return to this range during normal market conditions.
Strategic Usage:
Reversal Trading: Look for rejection signals when price enters Zone B areas
Breakout Confirmation: Volume expansion beyond Zone B boundaries suggests genuine breakouts
Support/Resistance: Zone A boundaries often provide reliable entry/exit levels
Mean Reversion: Price tends to gravitate toward the volume-weighted mean and POC lines
Unique Value Proposition
EZVP addresses three key limitations of traditional volume profiles:
Visual Clarity: Standard profiles can be cluttered and difficult to interpret quickly. EZVP's color-coded zones provide instant visual feedback about price significance.
Statistical Framework: Rather than relying on subjective interpretation of volume nodes, EZVP applies objective percentile-based classification, making support/resistance identification more systematic.
Forward-Looking Display: Rightward-projecting bars keep historical price action clean while maintaining current market structure visibility.
Configuration Guide
Lookback Period (10-1000): Controls the historical depth of volume calculation. Shorter periods for intraday scalping, longer for swing trading.
Number of Bins (20-200): Resolution of volume distribution. Higher values provide more granular analysis but may create noise on lower timeframes.
Zone Percentages:
Zone B: Extreme threshold (default 2.5% = ~2σ statistical significance)
Zone A: Significant threshold (default 14% = ~1σ statistical significance)
Visual Controls: Toggle individual elements (POC, median, mean, zone lines) to customize display complexity for your trading style.
Technical Requirements
Pine Script v6 compatible
Maximum bars back: 5000 (ensures sufficient historical data)
Maximum boxes: 500 (supports high-resolution bin counts)
Maximum lines: 50 (accommodates all zone and reference lines)
This indicator synthesizes volume profile theory with statistical zone analysis, providing a quantitative framework for identifying high-probability support/resistance levels based on volume distribution patterns rather than arbitrary price levels.
Rolling Angled Volume Profile [Trendoscope®]🎲 Volume Profile Indicators
🎯Traditional Volume Profile
Volume profile indicators visually represent the distribution of volume across price levels. These indicators typically operate on horizontal price levels, making them effective in identifying supply and demand zones in ranging markets. However, they are less useful in trending markets where price movements follow a slope.
🎯The Need for Angled Volume Profiles
Just as support and resistance levels differ from trendlines, volume profile indicators require an equivalent method to account for volume distribution along a sloped trajectory. This would enable more accurate volume analysis in trending markets.
We identified the need of Angled Volume profile and have already published few indicators that implements the concept.
Angled Volume Profile calculates volume distribution along a slope. Users interact with the indicator by selecting the starting point, after which the volume profile is calculated for the selected trajectory.
Volume Forks is another tool that extends angled volume profile analysis, aligning volume profiles along the trajectory of pitchforks.
🎲 Rolling Volume Profile Indicator
The Rolling Volume Profile offers a new approach to angled volume profile calculations, addressing some limitations of earlier implementations:
🎯 Rolling Calculation
The volume profile is calculated for the last N bars of the instrument
The slope of the profile lines is determined by the closing prices of the starting and ending bars
Profiles are drawn in the direction of price movement between the start and end bars.
🎯 Dynamic Updates
As new bars are added, the calculations are updated, and the profile is redrawn based on the latest data.
This dynamic behavior earns it the name "Rolling Volume Profile."
🎯 Advantages Over Earlier Versions
Unlimited Profile Lines : Unlike previous implementations limited to 500 profile lines, this indicator uses polyline objects, overcoming the restriction.
Live Updates : Previous angled volume profile tools lacked real-time updates when new bars appeared. This limitation is resolved in the Rolling Volume Profile Indicator.
The Rolling Volume Profile provides an efficient and scalable solution for analyzing volume in trending markets.
🎯 Indicator Settings
Simple settings include few customisable options
Visible Range Volume Profile Heatmap [MyTradingCoder]The Visible Range Volume Profile Heatmap indicator offers a visually striking and insightful way to analyze trading volume within the visible price range of your chart. This tool goes beyond traditional volume profiles by displaying volume distribution as a heatmap, where color intensity represents the volume traded at each price level.
Key Features:
Dynamic Heatmap: Displays volume concentration using a color gradient, making it easy to spot areas of high and low trading activity.
Customizable Grid: Choose between auto-scaling or manual grid configuration to suit your analysis needs.
Flexible Color Schemes: Select from tri-tone or two-tone color palettes to represent bullish and bearish volume.
Point of Control (POC) Overlay: Highlights the price level with the highest trading volume, a critical reference point for traders.
Adjustable Transparency: Fine-tune the visibility of the heatmap to balance it with other chart elements.
Lookback Period: Customize the number of bars used for volume profile calculation.
How to Use the Visible Range Volume Profile Heatmap:
The Visible Range Volume Profile Heatmap is a powerful tool that can significantly enhance your market analysis when used effectively. To get the most out of this indicator, start by observing the overall pattern of the heatmap. Areas with darker colors represent higher volume concentration, indicating price levels where significant trading activity has occurred. These areas often serve as important support or resistance levels, as they represent prices where many traders have established positions.
Pay close attention to the Point of Control (POC), represented by a line running through the heatmap. This line marks the price level with the highest trading volume and often acts as a magnet for price action. Price tends to gravitate towards the POC, making it a crucial reference point for potential reversals or continuations.
When analyzing potential trades, consider how the current price relates to the volume distribution shown in the heatmap. If the price is approaching a high-volume area from below, it might face resistance; conversely, if it's approaching from above, that area might provide support. Breakouts beyond significant volume nodes can be particularly noteworthy, as they may signal a shift in market sentiment.
Use the heatmap in conjunction with your existing trading strategies. For example, if you're a trend follower, you might look for breakouts beyond major volume areas as confirmation of trend continuation. If you're a mean reversion trader, you might consider entries when price moves away from high-volume nodes, anticipating a return to these heavily traded levels.
The indicator can also help in identifying potential profit targets. As price moves away from one volume node, it often continues until it reaches the next significant volume area. These areas can serve as logical places to consider taking profits or adjusting your position.
For longer-term analysis, observe how the volume profile changes over time. Shifts in the distribution of volume can indicate evolving market dynamics. A broadening of the high-volume area might suggest increasing uncertainty, while a narrowing could indicate building consensus about price.
Settings Explained:
Auto Grid Configuration:
The "Auto Scale" option automatically adjusts the grid size based on the visible chart area. This ensures optimal visualization regardless of your chart's dimensions or zoom level.
Auto Scale Grid Size: Determines the total number of cells in the heatmap. A higher number provides more granular detail but may increase calculation time.
Auto Scale Grid Ratio: Adjusts the aspect ratio of the grid cells. A higher ratio creates wider, more rectangular cells, while a lower ratio results in more square-shaped cells. Experiment to find the best visual representation for your analysis.
Lookback Period:
The lookback setting determines how many columns (bars) of historical data the indicator uses to calculate the volume profile. A larger lookback will provide a more comprehensive view of historical volume distribution but may be slower to react to recent changes. A smaller lookback will be more responsive to recent volume patterns but may miss longer-term trends.
Manual Grid Configuration:
If you prefer more control over the grid layout, you can switch to manual configuration:
Column Width: Sets the number of price bars each column of the heatmap represents. A wider column aggregates more data, smoothing out the profile.
Number of Rows: Determines the vertical resolution of the heatmap. More rows provide finer price level detail but may make the overall pattern less distinct.
Tips for Optimization:
For short-term trading, use a smaller lookback and finer grid settings to capture recent market dynamics.
For longer-term analysis, increase the lookback and use wider columns to identify persistent volume patterns.
If the heatmap appears too blocky, increase the number of rows or decrease the column width.
If the heatmap is too granular, making patterns hard to discern, do the opposite.
Remember, the ideal settings often depend on your specific trading timeframe, the asset you're analyzing, and your personal analytical preferences. Don't hesitate to experiment with different configurations to find what works best for your trading style.
Conclusion
The Visible Range Volume Profile Heatmap is more than just an indicator—it's a versatile tool that enhances your ability to analyze and interpret market data. By transforming volume profiles into an intuitive, color-coded heatmap, this indicator allows you to quickly identify critical price levels where significant trading activity has occurred. Whether you're a day trader focused on short-term moves or a swing trader analyzing longer-term trends, the customizable settings of this tool provide the flexibility needed to adapt to various market conditions.
The ability to configure the grid layout, adjust the lookback period, and fine-tune the color and transparency settings ensures that the heatmap can be tailored to your specific trading strategy. By highlighting key areas of support and resistance, identifying potential breakouts, and pinpointing the Point of Control (POC), the heatmap gives you actionable insights that can enhance your decision-making process.
Incorporate the Visible Range Volume Profile Heatmap into your trading routine to gain a deeper understanding of market dynamics and to spot opportunities that might otherwise go unnoticed. Remember to experiment with the settings to find the configuration that best suits your analysis style, and use this powerful indicator in conjunction with your existing strategies for optimal results. With the right approach, this tool can become an indispensable part of your trading toolkit, helping you navigate the markets with greater confidence and precision.
Bar Magnified Volume Profile/Fixed Range [ChartPrime]This indicator draws a volume profile by utilizing data from the lower timeframe to get a more accurate representation of where volume occurred on a bar to bar basis. The indicator creates a price range, and then splits that price range into 100 grids by default. The indicator then drops down to the lower timeframe, approximately 16 times lower than the current timeframe being viewed on the chart, and then parses through all of the lower timeframe bars, and attributes the lower timeframe bar volume to all grids that it is touching. The volume is dispersed proportionally to the grids which it is touching by whatever percent of the candle is inside each grid. For example, if one of the lower timeframe bars is interacting with "2" of the grids in the profile, and 60% of the candle is inside of the top grid, 60% of the volume from said candle will be attributed to the grid.
To make all of this magic happen, this script utilizes a quadratic time complexity algorithm while parsing and attributing the volume to all of the grids. Due to this type of algorithm being used in the script, many of the user inputs have been limited to allow for simplicity, but also to prevent possible errors when executing loops. For the most part, all of the settings have been thoroughly tested and configured with the right amount of limitations to prevent these errors, but also still give the user a broad range of flexibility to adjust the script to their liking.
📗 SETTINGS
Lookback Period: The lookback period determines how many bars back the script will search for the "highest high" and the "lowest low" which will then be used to generate the grids in-between
Number Of Levels: This setting determines how many grids there will be within the volume profile/fixed range. This is personal preference, however it is capped at 100 to prevent time complexity issues
Profile Length: This setting allows you to stretch or thin the volume profile. A higher number will stretch it more, vise versa a smaller number will thin it further. This does not change the volume profiles results or values, only its visual appearance.
Profile Offset: This setting allows you to offset the profile to the left or right, in the event the user does not appreciate the positioning of the default location of the profile. A higher number will shift it to the right, vise versa a lower number will shift it to the left. This is personal preference and does not affect the results or values of the profile.
🧰 UTILITY
The volume profile/fixed range can be used in many ways. One of the most popular methods is to identify high volume areas on the chart to be used as trade entries or exits in the event of the price revisiting the high volume areas. Take this picture as an example. The image clearly demonstrates how the 2 highest areas of volume within this magnified volume profile also line up to great areas of support and resistance in the market.
Here are some other useful methods of using the volume profile/fixed range
Identify Key Support and Resistance Levels for Setups
Determine Logical Take Profits and Stop Losses
Calculate Initial R Multiplier
Identify Balanced vs Imbalanced Markets
Determine Strength of Trends
Auto Anchored Volume ProfileAuto Anchored Volume profile indicator to identify potential support and resistance zones, along with weak and strong Point of Control (POC) levels.
Understanding the Concepts:
Volume Profile: This chart depicts trading activity at various price levels over a chosen timeframe. Higher volume areas represent price levels where most buying and selling happened.
Point of Control (POC): The price level with the highest volume traded within the timeframe. It represents the price where most agreement existed between buyers and sellers.
High Volume Nodes (HVN): Areas on the volume profile with significantly higher volume compared to surrounding areas. These can indicate potential support or resistance.
Delta (Sentimental): This volume profile type shows the difference between buying and selling volume at each price level. Positive delta indicates buying dominance, while negative delta suggests selling pressure.
Strategy Breakdown:
Identify Volume Shelves:
Look for areas with concentrated volume on the profile. These areas, called shelves, can act as support (high volume at lower prices) or resistance (high volume at higher prices).
Analyze POC Strength (POC Volume Percentage):
Calculate the Volume Percentage: (Volume at Price Level / Maximum HVN Volume over the Period) * 100
This ratio indicates the significance of the POC relative to the strongest volume area.
A high percentage suggests a strong POC, potentially indicating a more reliable support or resistance level.
A low percentage suggests a weak POC, with a higher chance of price breaking through that level.
Leverage Previous Session Data:
The strategy incorporates data from the previous session's POC and Highest Delta Node. These are displayed on the right side of the chart, extending the volume profile for reference.
Identify if the current price is trading above or below the previous session's POC. This can provide context for potential price direction.
The Highest Delta Node from the previous session indicates areas of strong buying or selling sentiment that might carry over to the current session.
Additional Anchor Point Types:
Pivot Points and Fixed Range Volume Profile can be added for further confirmation of support and resistance zones.
Pivot points are calculated automatically based on the price changes direction
Fixed Range Volume Profile focuses on a specific price range, allowing detailed analysis within that zone.
Timeframe Considerations(AUTO):
The resolution for calculating pivot points is determined automatically:
- For intraday resolutions up to and including 15 minutes, the daily (1D) timeframe is used.
- For intraday resolutions more than 15 minutes, the weekly (1W) timeframe is used.
- For daily resolutions, the monthly (1M) timeframe is used.
- For weekly and monthly resolutions, the 12-month (12M) timeframe is used.
Trading with the Strategy:
Look for price approaching a volume shelf identified on the profile.
Analyze the POC Volume Percentage to gauge the strength of the POC as potential support or resistance.
Consider the previous session's POC and Highest Delta Node for additional context.
Combine volume profile insights with other technical indicators and price action confirmation for entry and exit signals.
Remember, strong POCs with high volume shelves suggest more reliable support/resistance, while weak POCs indicate a higher chance of price movement beyond that level.
Important Notes:
Volume profile is a tool to identify potential trading zones, not a guaranteed predictor of future price movements.
Always practice proper risk management techniques, including stop-loss orders.
Backtest this strategy on historical data to understand its effectiveness before risking real capital.
By understanding volume distribution and POC strength, this strategy can help you make informed trading decisions based on where most buying and selling activity has occurred. Remember, a comprehensive trading approach that considers multiple factors is crucial for success.
Filtered Volume Profile [ChartPrime]The "Filtered Volume Profile" is a powerful tool that offers insights into market activity. It's a technical analysis tool used to understand the behavior of financial markets. It uses a fixed range volume profile to provide a histogram representing how much volume occurred at distinct price levels.
Profile in action with various significant levels displayed
How to Use
The script is designed to analyze cumulative trading volumes in different price bins over a certain period, also known as `'lookback'`. This lookback period can be defined by the user and it represents the number of bars to look back for calculating levels of support and resistance.
The `'Smoothing'` input determines the degree to which the output is smoothed. Higher values lead to smoother results but may impede the responsiveness of the indicator to rapid changes in volatility.
The `'Peak Sensitivity'` input is used to adjust the sensitivity of the script's peak detection algorithm. Setting this to a lower value makes the algorithm more sensitive to local changes in trading volume and may result in "noisier" outputs.
The `'Peak Threshold'` input specifies the number of bins that the peak detection mechanism should account for. Larger numbers imply that more volume bins are taken into account, and the resultant peaks are based on wider intervals.
The `'Mean Score Length'` input is used for scaling the mean score range. This is particularly important in defining the length of lookback bars that will be used to calculate the average close price.
Sinc Filter
The application of the sinc-filter to the Filtered Volume Profile reduces the risk of viewing artefacts that may misrepresent the underlying market behavior. Sinc filtering is a high-quality and sharp filter that doesn't manifest any ringing effects, making it an optimal choice for such volume profiling.
Histogram
On the histogram, the volume profile is colored based on the balance of bullish to bearish volume. If a particular bar is more intense in color, it represents a larger than usual volume during a single price bar. This is a clear signal of a strong buying or selling pressure at a particular price level.
Threshold for Peaks
The `peak_thresh` input determines the number of bins the algorithm takes in account for the peak detection feature. The 'peak' represents the level where a significant amount of volume trading has occurred, and usually is of interest as an indicative of support or resistance level.
By increasing the `peak_thresh`, you're raising the bar for what the algorithm perceives as a peak. This could result in fewer, but more significant peaks being identified.
History of Volume Profiles and Evolution into Sinc Filtering
Volume profiling has a rich history in market analysis, dating back to the 1950s when Richard D. Wyckoff, a legendary trader, introduced the concept of volume studies. He understood the critical significance of volume and its relationship with market price movement. The core of Wyckoff's technical analysis suite was the relationship between prices and volume, often termed as "Effort vs Results".
Moving forward, in the early 1800s, the esteemed mathematician J. R. Carson made key improvements to the sinc function, which formed the basis for sinc filtering application in time series data. Following these contributions, trading studies continued to create and integrate more advanced statistical measures into market analysis.
This culminated in the 1980s with J. Peter Steidlmayer’s introduction of Market Profile. He suggested that markets were a function of continuous two-way auction processes thus introducing the concept of viewing markets in price/time continuum and price distribution forms. Steidlmayer's Market Profile was the first wide-scale operation of organized volume and price data.
However, despite the introduction of such features, challenges in the analysis persisted, especially due to noise that could misinform trading decisions. This gap has given rise to the need for smoothing functions to help eliminate the noise and better interpret the data. Among such techniques, the sinc filter has become widely recognized within the trading community.
The sinc filter, because of its properties of constructing a smooth passing through all data points precisely and its ability to eliminate high-frequency noise, has been considered a natural transition in the evolution of volume profile strategies. The superior ability of the sinc filter to reduce noise and shield against over-fitting makes it an ideal choice for smoothing purposes in trading scripts, particularly where volume profiling forms the crux of the market analysis strategy, such as in Filtered Volume Profile.
Moving ahead, the use of volume-based studies seems likely to remain a core part of technical analysis. As long as markets operate based on supply and demand principles, understanding volume will remain key to discerning the intent behind price movements. And with the incorporation of advanced methods like sinc filtering, the accuracy and insight provided by these methodologies will only improve.
Mean Score
The mean score in the Filtered Volume Profile script plays an important role in probabilistic inferences regarding future price direction. This score essentially characterizes the statistical likelihood of price trends based on historical data.
The mean score is calculated over a configurable `'Mean Score Length'`. This variable sets the window or the timeframe for calculation of the mean score of the closing prices.
Statistically, this score takes advantage of the concept of z-scores and probabilities associated with the t-distribution (a type of probability distribution that is symmetric and bell-shaped, just like the standard normal distribution, but has heavier tails).
The z-score represents how many standard deviations an element is from the mean. In this case, the "element" is the price level (Point of Control).
The mean score section of the script calculates standard errors for the root mean squared error (RMSE) and addresses the uncertainty in the prediction of the future value of a random variable.
The RMSE of a model prediction concerning observed values is used to measure the differences between values predicted by a model and the values observed.
The lower the RMSE, the better the model is able to predict. A zero RMSE means a perfect fit to the data. In essence, it's a measure of how concentrated the data is around the line of best fit.
Through the mean score, the script effectively predicts the likelihood of the future close price being above or below our identified price level.
Summary
Filtered Volume Profile is a comprehensive trading view indicator which utilizes volume profiling, peak detection, mean score computations, and sinc-filter smoothing, altogether providing the finer details of market behavior.
It offers a customizable look back period, smoothing options, and peak sensitivity setting along with a uniquely set peak threshold. The application of the Sinc Filter ensures a high level of accuracy and noise reduction in volume profiling, making this script a reliable tool for gaining market insights.
Furthermore, the use of mean score calculations provides probabilistic insights into price movements, thus providing traders with a statistically sound foundation for their trading decisions. As trading markets advance, the use of such methodologies plays a pivotal role in formulating effective trading strategies and the Filtered Volume Profile is a successful embodiment of such advancements in the field of market analysis.
Multi Session Volume Profile LevelsThis script allows a user to plot current and historical volume profile levels (POC, VAH, VAL) of RTH (NY trading hours), ETH (Globex and/or Equities ETH), and Weekly Profiles.
Each profile has multiple settings to tailor how the user desires. The list includes:
Plotting the current volume profile
Plotting historical session/week volume profile levels
Many configuration options for colors, line styles, and labels
One feature not mentioned above is the ability to plot any untested (i.e. naked) level that will disappear once it is traded through. The way this feature works is if a level is traded through during RTH (NY session), the level will stop plotting and/or disappear at the end of that trading session if it is a session VP level (ETH or RTH) or at the end of the trading week for the weekly profile levels.
Limitations
There are some minor limitations due to pine script that need to be mentioned. The volume profile calculations utilize the 1 minute timeframe to allow for more granular plotting of the volume profile. This allows the script to mimic the native volume profile script as closely as possible. The timeframe used for the calculation can be changed to use 1m, 2m, 3m, or 5m. Please be aware that using a higher timeframe allows for more historical levels to be plotted but results less resolution of the volume profile itself.
An attempt was made to get this as close to the native volume profile levels as possible. While most of the time the levels in this script are within a handful of ticks of the native levels, there are situations where they can be far off. Double distribution days are where this script can sometimes deviate significantly from the native volume profile or in instances where there are two high volume nodes that are very similar in volume. Pine script does not provide the same resolution to volume that is used in the native volume profile script which is why the values may be different when comparing them.
Another item that might be encountered is calculation timeouts. Due to the amount of calculations needing to be done to plot these levels you may encounter calculation timeouts when first applying them to the chart and periodically during the use of the indicator. If this is encountered, simply change one of the inputs in the inputs tab to force it to recalculate and it will eventually provide the levels on the chart. I am working on trying to optimize this to reduce these calculation timeouts but this is as good as I could get it for now.
Future updates will include higher timeframe volume profile values but will require a bit more work to get it implemented. As always I am open to suggestions on how to make this script better as it provides a more automated way to utilize these levels than what is currently provided.
[Pt] Periodic Volume ProfileThis script is an attempt to recreate the Periodic Volume Profile that is built-in by TradingView, with slightly different features. Related blog: www.tradingview.com
This script is based on another script "Volume Profile, Pivot Anchored" by @dgtrd
*Note that only limited number Volume Profile can be displayed on the chart due to limitations on displaying boxes and lines.
Description
This Periodic Volume Profile (PVP) indicator allows trades to view volume profiles for periods longer than the current timeframe. The indicator builds one general volume profile for each new period, set by the user through the “Periodic Timeframe” input parameter.
This script also has the option to extend Point of Control (POC) lines with optional end conditions: Until Bar Touch, Until Last Bar, Until Bar Cross, or None, which extends to the right.
Signals are generated for Naked POC touches and crosses by a triangle symbol and a cross symbol, by default.
Alerts are available for POC touches and crosses.
What is Volume Profile?
Volume profile is a technical analysis tool that shows the volume of trades at different prices for a given security or market over a specific period of time.
Volume profile can be used to identify key levels of support and resistance, as well as to assess the overall supply and demand for a security. For example, if there is a high volume of trades at a particular price level, this may indicate that there is a significant level of support or resistance at that price. On the other hand, if there is relatively low volume at a particular price, this may indicate that there is not much interest in trading at that level.
Traders can use volume profile to identify trends, make trading decisions, and set stop-loss and take-profit orders. It can also be useful for identifying patterns such as "pockets of liquidity," which are areas where there is a high volume of trades but relatively little price movement.
It is important to note that volume profile should be used in conjunction with other technical analysis tools and should not be relied upon in isolation. It is also important to consider the overall context and market conditions when interpreting volume profile data.
Key Difference with TradingView's PVP indicator - TradingView's PVP intraday period does not align with standard intraday timeframes as it is determined by # of bars. This script provides volume profiles that aligns with higher timeframe periods.
Enjoy~!
ZigZag Volume Profile [ChartPrime]⯁ OVERVIEW
ZigZag Volume Profile combines swing structure with volume analytics by plotting a ZigZag of major price swings and overlaying a detailed volume profile around each swing. At the end of each swing, it highlights the Point of Control (POC) — the price level with the highest traded volume — and extends it forward to identify key areas of potential support or resistance.
⯁ KEY FEATURES
ZigZag Swing Detection:
Automatically detects swing highs and lows based on a user-defined length, creating clean visual segments of market structure.
These segments act as boundaries for volume profile calculations.
swingHigh = ta.highest(swingLength)
swingLow = ta.lowest(swingLength)
ZigZag Channel Visualization:
The ZigZag structure is connected with sloped lines, forming a visual “channel” of the price movement.
The ZigZag can optionally, scaled by ATR.
Volume Profile Around Each Swing:
For every completed swing (high to low or low to high), the indicator constructs a full volume profile using user-defined bin counts.
It scans volume across price levels in the swing and plots histogram-style bins using a gradient color to indicate volume magnitude.
Dynamic Bin Width and Slope Adjustment:
Bins are distributed across a vertical ATR-based range, and their width is adjusted based on the percentage of total swing volume.
The volume fill direction is adapted to the swing’s slope for visually aligned plotting.
POC Detection and Extension:
The highest volume bin in each swing is identified as the Point of Control (POC).
This level is plotted with a thicker line and extended horizontally into the future as a key reaction level.
Automatic POC Expiry on Price Interaction:
POC lines are continuously extended unless breached by price.
When price crosses the POC level, the extension is terminated — signaling that the level may have been absorbed.
Clean Volume Bin Visualization:
Bin colors range from green (low volume) to blue (higher volume), with the POC always marked in red by default for easy identification.
Volume percentages are optionally labeled at each bin level.
Flexible Swing Profile Parameters:
Users can control:
Number of volume bins
Bin width
Channel width (ATR factor)
Visibility of the swing channel or POC lines
Efficient Memory Handling:
Old POC lines and volume profiles are automatically removed from memory after a threshold to keep charts clean and performant.
⯁ USAGE
Use ZigZag swings to define market structure visually.
Analyze volume profile around each swing to understand where most trading activity occurred.
Use POC extensions as dynamic support/resistance zones for entries, stops, or take-profits.
Watch for price interaction with extended POC lines — breaks may suggest absorbed liquidity or breakout potential.
Use the ATR-based channel width to adapt profiles based on market volatility.
⯁ CONCLUSION
ZigZag Volume Profile offers a powerful fusion of structure and volume. By plotting detailed volume profiles over each price swing and extending the POC as actionable S/R levels, this tool provides deep insight into market participation zones — giving traders a tactical edge in both ranging and trending environments.
Fibonacci Volume Profiles [AlgoAlpha]Unlock a deeper understanding of price action with the Fibonacci Volume Profiles indicator by AlgoAlpha! This powerful tool blends Fibonacci retracement levels with customizable volume profiles, helping traders identify high-probability areas of support, resistance, and accumulation. Designed for both continuous dynamic levels and custom time periods, this indicator is a must-have for traders seeking confluence in market structure analysis.
🔑 Key Features
📈 Dual Mode Selection : Choose between Continuous Fibonacci levels, which adapt dynamically to pivots, or a Custom Period mode, where you set your own start and end points.
📊 Integrated Volume Profile : Visualize volume distributions at key Fibonacci retracement levels, revealing areas of strong buying/selling interest.
🎨 Customizable Colors & Transparency : Adjust Fibonacci level colors, fill zones, and profile transparency for a visually clear experience.
🔍 Profile Resolution & Scaling : Control the number of price levels and width of the volume profile for detailed market insights.
🛠 Extendable Levels : Optionally extend Fibonacci levels to the right of the chart for better visualization of future price interaction.
📌 How to Use
Add the Indicator: Click on the star icon to add it to your favorites and apply it to your TradingView chart.
Analyze The Market: Observe how price interacts with Fibonacci levels alongside the volume profile to confirm support/resistance zones. Switch between custom range or continuous mode to align the tool with your trading style.
⚙️ How It Works
The indicator calculates pivot highs/lows dynamically (or uses user-defined time periods) to plot Fibonacci retracement levels. It then builds a volume profile by analyzing historical volume data, grouping it into price bins to highlight volume-heavy zones. The Point of Control (PoC) is identified as the level with the highest traded volume, acting as a key price magnet. The color-coded Fibonacci levels help traders spot retracement zones, while the volume profile confirms strength or weakness in those areas.
Weighted Volume Profile Pivot Points | Flux Charts💎 GENERAL OVERVIEW
Introducing our new Weighted Volume Profile Pivot Points (WVPPP) Indicator! This indicator renders a volume profile using the latest pivot points, automatically adjusting itself when new pivots occur. The pivoting mode can be switched between default pivot points and order blocks mode. It can be adjusted to give more weight to recent or past candlesticks, or can be used as a normal volume profile. For more information, please read the full write-up.
Features of the new Weighted Volume Profile Pivot Points (WVPPP) Indicator :
Renders Volume Profile Of The Range Between Latest Pivots
Two Pivoting Modes Including Order Blocks Mode
Adjustable Weighthing Towards Past or Recent
Customizable Row Count & Maximum Distance
Left or Right Alignment
More Styling Options
🚩UNIQUENESS
This indicator stands out with two key features. One is it's ability to weight volumes based on their distance to the current time. Giving weight to volumes may offer new trading opportunities to traders as they can now see the most recent Point Of Control (POC) or a more powerful but past POC based on their choice. Another key feature the indicator has is that it automatically finds latest valid pivot points, and uses that range for the volume profile. The range changes dynamically as new pivots points emerge. You can select between normal pivot points and order blocks mode. The indicator also has a variety of useful styling settings such as aligning the volume profile to the right or the left of the chart, POC Line styling and color settings for bullish & bearish volumes.
📌 HOW DOES IT WORK ?
A volume profile provides an in-depth look at trading activity over a period of time by plotting a histogram on the price axis. This indicator can also give weight to volumes based on their distance to the current time, essentially determining their importance for the profile. The range which the volume profile will cover is determined by the latest pivot points. Here is how it works step-by-step :
1. Determine how much candlesticks the volume profile will cover (Analyze Bars setting)
2. Find the latest pivot points. If the mode is set to "Pivots", the pivot points are the candlesticks which has the highest / lowest wick in X amount of bars (Swing Length setting). If the mode is set to "Order Blocks", the volume profile range is the area between the latest buyside order block and the sellside order block. Order blocks occur when there is a high amount of market orders exist on a price range. It is possible to find order blocks using specific candlestick formations on the chart. For more information about the order block detection, I suggest you checking the write-up of our "Volumized Order Blocks" script. Increasing the "Swing Length" setting is recommended when the mode is set to "Pivots", as this will help in finding stronger pivot points.
3. Make a range using the latest pivot points, then divide it into rows (Row Count setting)
4. Then for each candlestick, add it's volume to the corresponding row in the range. Note that the volume can be added into several rows if it overlaps with them all.
5. If the candlestick is a bullish candlestick, we add it's volume into the bullish volume of the row, if it's a bearish candlestick, we add it to the bearish volume of the row.
With the weighted volume mode, which is activated if "Volume Weighthing" setting is set to "Recent" or "Past", all volumes get a penalty based on their distance to the latest candletstick. For example, if the setting is set to "Recent", the latest candlestick contributes it's volume by 100% to the corresponding row, but the candlestick which is 50 candlesticks far from the current candlestick only contributes it's volume by ~17% to the row. The same applies to the "Past" setting, but in the reversed order, where past candlesticks have more priority than the current ones.
Volume contribution percent for "Recent" setting : ((100 * 0.85) / (i + 1)) + (100 * (1.0 - 0.85))
Volume contribution percent for "Past" setting : ((100 * 0.85) * ((i + 1) / N)) + (100 * (1.0 - 0.85))
Where i = candlestick index from right to left, N = total number of candlesticks analyzed by the volume profile.
The Point Of Control (POC) line is drawn from the row with the most total volume, and is generally considered as a strong level because a lot of trading volume happened on that particular row. Traders may use this line as a support & resistance level.
We believe that automatically ranging the volume profile to important pivot points will help traders see crucial volume information easier without unnecessary hassle. Traders can use this indicator to have an insight of areas which price moves quickly without much volume, or see areas that holds the price still for much longer and plan their trades accordingly.
⚙️SETTINGS
1. General Configuration
Mode -> The pivoting mode that is switchable between "Pivots" and "Order Blocks" as described in the write-up. Please read the upper section to understand how this setting works.
Analyze Bars -> Total amount of bars that will be analyzed by the indicator from right to left.
Row Count -> The amount of rows that will the vertical range between pivot points will be divided into.
Volume Weighting -> The volume weighting mode as explained in the write-up.
2. Style
Highlight Sessions -> The volume profile sessions will be highlighted with a blue tint. To prevent confusion, highlighting will not work if the alignment is set to "Right".
Align To -> The alignment of the volume profile.
Weighted Volume Profile | Flux Charts💎 GENERAL OVERVIEW
Introducing our new Weighted Volume Profile Indicator! This indicator renders a volume profile based on the volume of latest candlesticks. It can be adjusted to give more weight to recent or past candlesticks, or can be used as a normal volume profile. For more information, please read the full write-up.
Features of the new Weighted Volume Profile indicator :
Renders Volume Profile Of Current Ticker
Adjustable Weighthing Towards Past or Recent
Customizable Row Count & Maximum Distance
Left or Right Alignment
More Styling Options
🚩UNIQUENESS
This indicator differs from a normal volume profile indicator by it's ability to weight volumes based on their distance to the current time. Giving weight to volumes may offer new trading opportunities to traders as they can now see the most recent Point Of Control (POC) or a more powerful but past POC based on their choice. The indicator also has a variety of useful styling settings such as aligning the volume profile to the right or the left of the chart, POC Line styling and color settings for bullish & bearish volumes.
📌 HOW DOES IT WORK ?
A volume profile provides an in-depth look at trading activity over a period of time by plotting a histogram on the price axis. This indicator can also give weight to volumes based on their distance to the current time, essentially determining their importance for the profile. Here is how it works step-by-step :
1. Determine how much candlesticks the volume profile will cover (Analyze Bars setting)
2. Make a range from the highest point of chart to the lowest point of chart, then divide it into rows (Row Count setting)
3. For each candlestick, add it's volume to the corresponding row in the range. Note that the volume can be added into several rows if it overlaps with them.
4. If the candlestick is a bullish candlestick, we add it's volume into the bullish volume of the row, if it's a bearish candlestick, we add it to the bearish volume of the row.
With the weighted volume mode, which is activated if "Volume Weighthing" setting is set to "Recent" or "Past", all volumes get a penalty based on their distance to the latest candletstick. For example, if the setting is set to "Recent", the latest candlestick contributes it's volume by 100% to the corresponding row, but the candlestick which is 50 candlesticks far from the current candlestick only contributes it's volume by ~17% to the row. The same applies to the "Past" setting, but in the reversed order, where past candlesticks have more priority than the current ones.
Volume contribution percent for "Recent" setting : ((100 * 0.85) / (i + 1)) + (100 * (1.0 - 0.85))
Volume contribution percent for "Past" setting : ((100 * 0.85) * ((i + 1) / N)) + (100 * (1.0 - 0.85))
Where i = candlestick index from right to left, N = total number of candlesticks analyzed by the volume profile.
The Point Of Control (POC) line is drawn from the row with the most total volume, and is generally considered as a strong level because a lot of trading volume happened on that particular row. Traders may use this line as a support & resistance level.
Traders can use this indicator to have an insight of areas which price moves quickly without much volume, or see areas that holds the price still for much longer and plan their trades accordingly.
⚙️SETTINGS
1. General Configuration
Analyze Bars -> Total amount of bars that will be analyzed by the indicator from right to left.
Row Count -> The amount of rows that will the vertical range of chart will be divided into.
Volume Weighting -> The volume weighting mode as explained in the write-up.
2. Style
Align To -> The alignment of the volume profile.
Market sessions and Volume profile - By LeviathanThis script allows you to keep track of Forex market sessions (Tokyo, London and New York), as well as Daily, Weekly and Monthly sessions. All of them are accompanied by Volume Profile options where you can view VP Histogram, Point of Control, Value Area High and Value Area Low.
Colors, lines and other design preferences are fully customizable.
* Volume Profile of shorter sessions (eg. Tokyo, London, New York) works better when using lower timeframes such as 15min, 5min, etc.
** Use timeframe higher than 15min when viewing Monthly sessions
Indicator settings overview:
SESSION TYPE
- Tokyo session (1:00 - 9:00 UTC/ GMT )
- London session (7:00 - 16:00 UTC/ GMT )
- New York session (13:00 - 22:00 UTC/ GMT )
- Daily session
- Weekly session
- Monthly session
DISPLAY
- Show Volume Profile (Show or hide Volume Profile histogram)
- Show POC (Show or hide Point Of Control line)
- Show VAL (Show or hide Value Area Low line)
- Show VAH (Show or hide Value Area High line)
- Show Live Zone (Show or hide the ongoing session)
VOLUME PROFILE SETTINGS
- Resolution (The higher the value, the more refined of a profile, but less profiles are shown on the chart)
- Smooth Volume Data (Useful for assets that have very large spikes in volume over large bars, helps create better profiles)
APPEARANCE
- Up Volume color (Pick a custom color for up/ bullish volume profile nodes)
- Down Volume color (Pick a custom color for down/ bearish volume profile nodes)
- POC color and thickness (Pick a custom color and thickness for Point Of Control line)
- VAH color and thickness (Pick a custom color and thickness for Value Area High line)
- VAL color and thickness (Pick a custom color and thickness for Value Area Low line)
- Session box thickness (Pick a custom thickness for the session box. Color is provided automatically with optimal contrast)
** Some VP elements are inspired by @LonesomeTheBlue's volume profile script
Sonarlab - Volume ProfileThis Volume Profile is a charting tool that traders use to show the traded volume amount over a given time period. The reason we build this volume profile indicator is to confirm S&D zones and show where the most volume is resting in a specific given time.
Settings
- Auto Placement: Option to have the Volume Profile automatically placed
- Manual Placement: Able to place and move the Volume Profile anywhere of your choosing
- Bull vs. Bear Candle Style
- Up/Down Candle Style
- Highlight Point of Control (PoC)
Usage:
Focused on combining with SMC:
When trading SMC, normal volume profiles can be confusing and hard to trade - since it will catch the volume on the overall chart you're on. When trading SMC, we are interested in catching specific parts in a range which defines supply or demand.
What makes this volume profile different?
The Sonarlab Volume Profile is focused on combining with SMC, integrated with Smart Money Concepts (SMC) levels, such as the Swing High and Low levels. The Indicator will automatically find the most applicable position using our custom Swing Levels to provide users with maximum utility with zero effort. Where other volume profiles are more focused on overall volume, this volume profile is focused on volume in a specific range on automation using swing points in the market.
As in this example, the high volume areas are matching with traditional supply and demand zones. The price level with the most volume is highlighted by the "point of control" (POC), displayed by the yellow line. We can consider price will react from those "high volume" areas and trade more easily through "low volume" areas.
Session Volume Profile (DeadCat)Volume Profile is a charting study that displays trading activity over specific time periods at various price levels. It appears as a horizontal histogram on the chart, revealing where traders have shown the most interest based on volume concentration.
This Volume Profile automatically anchors to user-selected timeframes, creating fresh volume analysis for each new period while maintaining clean, systematic visualization of price-volume relationships.
Core Components :
Point of Control (POC): The price level with the highest volume activity during the selected period, marked with a yellow line and left-side label.
Value Area High/Low (VAH/VAL): Price boundaries that contain a specified percentage of the total volume (default 40%), helping identify the main trading range where most activity occurred.
Volume Histogram: Left-aligned bars showing volume distribution across price levels, with value area highlighting for enhanced visual clarity.
Key Features :
- Automatic Period Detection: Supports hourly, daily, weekly, and monthly timeframe anchoring
- Customizable Granularity: Adjustable rows (10-500) for different price resolution needs
- Labels: Clear POC, VAH, and VAL identification positioned at profile start
- Toggle Controls**: Optional display for volume rows, key levels, and background fills
- Clean Visualization: Profiles reset automatically at each new period for current market focus
Display Options :
- Profile Rows: Show/hide the volume histogram bars
- Key Level Lines: Individual controls for POC, VAH, and VAL display
- Value Area Background: Optional shading between VAH and VAL levels
- Color Customization: Separate color controls for all visual elements
The indicator provides systematic volume analysis by creating fresh profiles at regular intervals, helping traders identify significant price levels and volume patterns within their preferred timeframe structure.
Disclaimer : This indicator is for educational and informational purposes only. Trading decisions should be based on comprehensive analysis and proper risk management. Past performance does not guarantee future results.
Price Range Volume Profile++ [Pt]█ Introduction
The Price Range Volume Profile++ (PRVP++) is an advanced, feature-rich indicator specifically designed for volume profile users for in-depth volume analysis. Unlike most other volume profile tools that are limited to a 5000-bar lookback, PRVP++ can utilize all available candles on the chart, offering an unparalleled scope of historical data analysis.
█ Main Features
Full Chart Historical Lookback : PRVP++ sets a new standard with its ability to analyze the entire history of candles available on a chart, far exceeding the typical 5000-bar limit of other tools. This feature allows traders to conduct a comprehensive and detailed study of volume data over extensive time periods.
Volume Profile Analysis : The tool provides an in-depth volume profile analysis, showcasing the distribution of trading activity across different price levels. This is crucial for identifying key areas of interest in the market.
Bull/Bear Strength Profile : A standout feature that displays the relative strength of buyers (bulls) and sellers (bears) at different price levels. This visual representation helps traders gauge market sentiment and power dynamics.
Automatic HVN and LVN Identification : PRVP++ automatically highlights High Volume Nodes (HVNs) and Low Volume Nodes (LVNs), making it easier for traders to identify significant zones of trading activity and potential breakout areas.
Customization and Visual Enhancements : Offers customization for the profile's width, horizontal offset, and a sophisticated gradient color scheme for HVNs and LVNs, enhancing the tool's visual appeal and analytical utility.
█ Input Parameters
Price Range : Sets the percentage distance for the volume profile relative to the current closing price, determining the extent of volume data analysis.
Profile Step Size (Tick Size) : Users can choose automatic sizing or set a specific tick step size, offering flexibility in the granularity of the volume profile.
Volume Profile Options : Includes settings for gradient power and color selections for high and low volume areas, along with a fun mode for random color variations.
Profile Placement and Appearance : Adjustments for profile width, horizontal offset, and the option for background fill to enhance visibility.
Background Fill : Allows users to fill the background of the volume profile range, enhancing the visual impact and readability.
Time Weighted Profile : An option that weights the volume profile to give more emphasis to recent trading activities, highlighting the impact of recent market movements.
Smooth Filter : A feature that smoothens the volume profile to reduce noise and fluctuations, offering a clearer view of dominant volume levels.
High and Low Volume Node Settings : Customizable detection settings for HVNs and LVNs, line styles, label text sizes, and the option to extend lines for clearer market analysis.
Extra Settings : Includes displaying the current price on the profile, a customizable settings table with adjustable location and font size, and table opacity.
Random Color Generation : A feature for dynamically changing the colors used in the volume profile.
█ Possible Use Cases
Long-Term Market Analysis : Due to its ability to analyze all available candles on the chart, PRVP++ is exceptionally suited for long-term market analysis. Traders can study the historical volume profile over extended periods, identifying significant volume trends and shifts that could impact long-term investment strategies.
Identifying Key Support and Resistance Levels : The automatic HVN and LVN identification feature of PRVP++ makes it easier for traders to spot potential support and resistance levels. HVNs often correspond to strong support or resistance zones where significant trading activity has occurred, while LVNs may indicate levels where the price could break through more easily.
Gauging Market Sentiment with Bull/Bear Strength Profile : The Bull/Bear Strength Profile helps traders understand the prevailing market sentiment at different price levels. By analyzing the dominance of buying or selling pressure, traders can align their trades with the market's direction or prepare for potential reversals.
Intraday Trading and Scalping : For intraday traders and scalpers, the time-weighted feature and the ability to adjust profile step size offer valuable insights. By emphasizing recent trading activity and adjusting the granularity of the profile, traders can make more informed decisions based on short-term price movements and volume changes.
Breakout Trading : By utilizing the LVN identification, traders can pinpoint areas with low trading activity that might serve as potential breakout points. This information can be instrumental in formulating strategies to capitalize on sudden price movements.
Volume Gap Analysis : PRVP++ can be used to identify volume gaps, which are areas with significantly low volume. These gaps can act as important indicators for price movements, as prices may move quickly through these levels due to the lack of historical trading activity.
Risk Management and Position Sizing : Understanding the volume profile can aid in better risk management and position sizing. By recognizing areas of high and low volume, traders can set stop-loss orders more effectively and adjust their position sizes according to the perceived strength of support or resistance levels.
Swing Trading : For swing traders, the comprehensive historical lookback and HVN/LVN analysis provide critical information about where to enter and exit trades. Swing traders can utilize these features to identify trend reversals and momentum shifts.
█ Best Practices and Tips
Start with a Clear Understanding : Before utilizing PRVP++, ensure you have a solid grasp of volume profile concepts. Understanding High Volume Nodes (HVNs), Low Volume Nodes (LVNs), and their implications on market behavior is crucial.
Combine with Other Analysis Tools : While PRVP++ is powerful, it's most effective when used in conjunction with other technical analysis tools and indicators. Combining volume profile data with price action analysis, trend lines, and technical indicators can provide a more comprehensive market view.
Customize According to Your Trading Style : Tailor the tool's settings to fit your trading strategy. Day traders might prefer a more detailed profile, while long-term investors may benefit from broader data analysis.
Pay Attention to HVNs and LVNs : HVNs can indicate potential support or resistance areas, while LVNs might suggest breakout points. Monitor these areas closely for trading opportunities.
Utilize the Full Historical Lookback Feature : For a broader perspective, use the full historical lookback feature to understand long-term volume patterns and their impact on current price movements.
Keep an Eye on Bull/Bear Strength : Use the Bull/Bear Strength Profile to gauge market sentiment at different price levels. This can help in predicting potential price movements.
Regularly Update Your Strategy : As market conditions change, regularly review and adjust your use of PRVP++ to ensure it aligns with current market dynamics.
Stay Informed About Market News : Be aware of how economic news and global events might affect the volume and price, as these factors can significantly impact the effectiveness of volume-based strategies.
█ Disclaimers and Risk Advice
No Guarantee of Profits : Trading involves risk, and the use of the PRVP++ tool does not guarantee profits. Always be aware of the potential for loss.
Educational Purposes Only : The information provided by PRVP++ is for educational purposes only and should not be considered financial advice.
Not a Standalone Tool : PRVP++ should not be used as a standalone decision-making tool. Combine it with comprehensive market analysis and personal judgment.
Past Performance Not Indicative of Future Results [/b: Historical data and trends analyzed by PRVP++ do not guarantee future market behavior.
Use Risk Management : Always employ sound risk management strategies, including setting stop-loss orders and managing position sizes to protect your capital.
Personal Responsibility : Trading decisions remain the responsibility of the individual trader. Use PRVP++ as one of several tools in your decision-making process.
Interactive Volume Profile - Based on LTF volumeHere is my first attempt on defining volume profile. In this script, I am using new feature of pine security_lower_tf
Upon loading the script, it will ask users to select Time range to show the volume profile. Once you select the time range, confirmation input will popup. Upon confirming the inputs, you will be able to view the volume profile
Settings are pretty simple. Some of them appear as part of confirmation.
Limitation due to availability of LTF bars
security_lower_tf can only fetch upto 100k bars, Hence, if we move the starting point beyond that, we will only see volume profile from the bar where LTF volume data is available. Increasing lower timeframe resolution will also increase the available range of volume profile. Option also available to use max range instead of time based range. If max bar range is selected, then volume profile is drawn based on all the bars for which LTF volume is available.
An example of all combinations are show below.
Selecting the granularity of volume profile
Number of levels can be set from settings which impacts the granularity of volume profile. Below is the example of how different values for number of levels behave.
Price Range Volume Profile [Pt]█ Introduction
The Price Range Volume Profile (PRVP) is a revolutionary indicator. This tool stands out from its peers due to its unique ability to capture the entire price chart history, thus providing a comprehensive volume profile of the entire asset's trading history, as available on TradingView chart. It's worth noting that I believe this tool is the first of its kind to accomplish such a feat. A much recommended tool if you are a volume profile trader.
█ Main Features
► Historical Lookback: This feature dives deep into the past, grasping all the historical data of an asset. It's equipped to handle up to 20,000 bars, although users without a premium TradingView account are advised to keep it at a maximum of 10,000 bars, or just use the "Full Historical Lookback" feature.
► Volume Profile / POC: Displays the distribution of volume across price levels for the selected price range. The Point of Control (POC), which is the price level with the highest traded volume, is also highlighted.
► Customization: Users have the flexibility to adjust the profile's appearance, including profile width, horizontal offset, and the option to fill the background of the profile range.
► Time Weighting: This feature allows users to give more weight to recent trading activity, which can be especially useful for intraday traders or during times of high volatility. Note that this feature will impact the volume profile and POC level.
► Settings Table: A settings table is displayed on the chart for users to quickly reference their input parameters.
█ Input Parameters
► Lookback Timeframe: Determines the period for which the volume profile is generated.
► Price Range: The percentage distance to consider for the profile, adjusted above and below the current closing price.
► Profile Step size: The granularity of the volume profile. Users can opt for automatic step size based on a predefined calculation or set their preferred tick step size.
► Historical Bars Lookback: Determines the number of bars to include in the volume profile calculation.
► Profile Visuals: Adjust the appearance and layout of the volume profile on the chart.
► Extra: Additional settings including the display of a settings table and its location.
█ Basic Understanding of Volume Profile - How to use PRVP?
Volume Profile is a valuable tool for traders who want insights into where the majority of trading activity has occurred. Here are some tips to make the most of it:
► Understand the Basics: Before using the Volume Profile, ensure you understand the difference between it and the standard volume histogram. While both represent volume, the former displays it against price while the latter shows it against time.
► Identify High Volume Nodes (HVN) and Low Volume Nodes (LVN):
◊ HVN: Areas where there's a lot of trading activity and where the price has spent a lot of time. These areas can act as strong support or resistance.
◊ LVN: Areas where there's a lack of trading activity. Prices might move quickly through these areas, and they can act as potential breakpoints or accelerators for price movement.
► Locate the Point of Control (POC): This is the price level with the highest traded volume for a specified period. It often acts as a magnet for price, and it can serve as a pivot or reference point.
► Trend Confirmation: A shift in the volume profile from one price level to another can confirm a trend. For instance, if higher volume starts to build at higher price levels, it may indicate a strong uptrend.
► Watch for Volume Gaps: If there's a significant gap in the volume profile, prices may move quickly through these levels as there's little historical trading activity to act as support or resistance.
█ Other Usage Tips
◊ For optimal performance, ensure that the chosen timeframe aligns closely with the chart timeframe. Differences in timeframes may lead to minor discrepancies in the volume profile.
◊ To address any errors arising from too many levels displayed on the volume profile, consider increasing the Profile Step size or reducing the Price Range.
Institutional Volume Profile# Institutional Volume Profile (IVP) - Advanced Volume Analysis Indicator
## Overview
The Institutional Volume Profile (IVP) is a sophisticated technical analysis tool that combines traditional volume profile analysis with institutional volume detection algorithms. This indicator helps traders identify key price levels where significant institutional activity has occurred, providing insights into market structure and potential support/resistance zones.
## Key Features
### 🎯 Volume Profile Analysis
- **Point of Control (POC)**: Identifies the price level with the highest volume activity
- **Value Area**: Highlights the price range containing a specified percentage (default 70%) of total volume
- **Multi-Row Distribution**: Displays volume distribution across 10-50 price levels for detailed analysis
- **Customizable Period**: Analyze volume profiles over 10-500 bars
### 🏛️ Institutional Volume Detection
- **Pocket Pivot Volume (PPV)**: Detects bullish institutional buying when up-volume exceeds recent down-volume peaks
- **Pivot Negative Volume (PNV)**: Identifies bearish institutional selling when down-volume exceeds recent up-volume peaks
- **Accumulation Detection**: Spots potential accumulation phases with high volume and narrow price ranges
- **Distribution Analysis**: Identifies distribution patterns with high volume but minimal price movement
### 🎨 Visual Customization Options
- **Multiple Color Schemes**: Heat Map, Institutional, Monochrome, and Rainbow themes
- **Bar Styles**: Solid, Gradient, Outlined, and 3D Effect rendering
- **Volume Intensity Display**: Visual intensity based on volume magnitude
- **Flexible Positioning**: Left or right side profile placement
- **Current Price Highlighting**: Real-time price level indication
### 📊 Advanced Visual Features
- **Volume Labels**: Display volume amounts at key price levels
- **Gradient Effects**: Multi-step gradient rendering for enhanced visibility
- **3D Styling**: Shadow effects for professional appearance
- **Opacity Control**: Adjustable transparency (10-100%)
- **Border Customization**: Configurable border width and styling
## How It Works
### Volume Distribution Algorithm
The indicator analyzes each bar within the specified period and distributes its volume proportionally across the price levels it touches. This creates an accurate representation of where trading activity has been concentrated.
### Institutional Detection Logic
- **PPV Trigger**: Current up-bar volume > highest down-volume in lookback period + above volume MA
- **PNV Trigger**: Current down-bar volume > highest up-volume in lookback period + above volume MA
- **Accumulation**: High volume + narrow range + bullish close
- **Distribution**: Very high volume + minimal price movement
### Value Area Calculation
Starting from the POC, the algorithm expands both upward and downward, adding volume until reaching the specified percentage of total volume (default 70%).
## Configuration Parameters
### Profile Settings
- **Profile Period**: 10-500 bars (default: 50)
- **Number of Rows**: 10-50 levels (default: 24)
- **Profile Width**: 10-100% of screen (default: 30%)
- **Value Area %**: 50-90% (default: 70%)
### Institutional Analysis
- **PPV Lookback Days**: 5-20 periods (default: 10)
- **Volume MA Length**: 10-200 periods (default: 50)
- **Institutional Threshold**: 1.0-2.0x multiplier (default: 1.2)
### Visual Controls
- **Bar Style**: Solid, Gradient, Outlined, 3D Effect
- **Color Scheme**: Heat Map, Institutional, Monochrome, Rainbow
- **Profile Position**: Left or Right side
- **Opacity**: 10-100%
- **Show Labels**: Volume amount display toggle
## Interpretation Guide
### Volume Profile Elements
- **Thick Horizontal Bars**: High volume nodes (strong support/resistance)
- **Thin Horizontal Bars**: Low volume nodes (weak levels)
- **White Line (POC)**: Strongest support/resistance level
- **Blue Highlighted Area**: Value Area (fair value zone)
### Institutional Signals
- **Blue Triangles (PPV)**: Bullish institutional buying detected
- **Orange Triangles (PNV)**: Bearish institutional selling detected
- **Color-Coded Bars**: Different colors indicate institutional activity types
### Color Scheme Meanings
- **Heat Map**: Red (high volume) → Orange → Yellow → Gray (low volume)
- **Institutional**: Blue (PPV), Orange (PNV), Aqua (Accumulation), Yellow (Distribution)
- **Monochrome**: Grayscale intensity based on volume
- **Rainbow**: Color-coded by price level position
## Trading Applications
### Support and Resistance
- POC acts as dynamic support/resistance
- High volume nodes indicate strong price levels
- Low volume areas suggest potential breakout zones
### Institutional Activity
- PPV above Value Area: Strong bullish signal
- PNV below Value Area: Strong bearish signal
- Accumulation patterns: Potential upward breakouts
- Distribution patterns: Potential downward pressure
### Market Structure Analysis
- Value Area defines fair value range
- Profile shape indicates market sentiment
- Volume gaps suggest potential price targets
## Alert Conditions
- PPV Detection at current price level
- PNV Detection at current price level
- PPV above Value Area (strong bullish)
- PNV below Value Area (strong bearish)
## Best Practices
1. Use multiple timeframes for confirmation
2. Combine with price action analysis
3. Pay attention to volume context (above/below average)
4. Monitor institutional signals near key levels
5. Consider overall market conditions
## Technical Notes
- Maximum 500 boxes and 100 labels for optimal performance
- Real-time calculations update on each bar close
- Historical analysis uses complete bar data
- Compatible with all TradingView chart types and timeframes
---
*This indicator is designed for educational and informational purposes. Always combine with other analysis methods and risk management strategies.*
Footprint Chart + Volume ProfileFootprint charts provide volume information to candlestick charts. This indicator specifically provides the quantity of Market Orders executed on each side of the Order Book, thereby showing you the number of contracts that had hit the bid or the offer - and it does so on each bar.
In addition, it visualises a Volume Profile for each bar, providing you an even better visualisation, contrasted to that which renders the numbers alone.
This Footprint Chart calculates executed orders by getting the change in volume for every price move and pooling them on their corresponding "tick bucket". Their specific "tick bucket" is calculated on the nearest "tick", the size of which you will provide by setting the "Tick Size/ Increment" to whichever tick size you need .
For instance, volume changes on a price of 10.4 on a 1 tick Footprint Chart will be recorded as part of the nearest whole number(10), while on a 3 tick Footprint Chart, it will be recorded as part of 9 as it is the nearest multiple of 3.
Calculating the "tick bucket" this way is most conservative, however, if you would like it calculated differently — Having the volume changes recorded on the succeeding tick, e.g. Recording 10.4 as 12 on a 3 tick Footprint Chart. Simply set the "Tick Basket Assignment" to "Next Tick", While setting the same to "Previous Tick" records volume changes on the preceding tick. Default is "Nearest Tick".
How to read the Footprint Chart?
This Footprint Chart depicts a portion of the Depth of Market, arranged in such a way that the left side represents the bid, while the right side represents the ask. It is therefore natural that orders hitting the bid (Market Sells) are to be placed on the Left Side of the chart while orders hitting the ask (Market Buys) are to be placed on the Right Side. This way, you can visualise how the current price came to be, as well as observe with the several order flow analysis concepts and ideas you can apply. In summary, numbers on the Left represents Sell Orders and numbers on the Right represents Buy Orders.
If, however, you wish to see only the total volume that transacted within the bar, you may do so by toggling the "Split Buy and Sell" option.
Footprint Chart showing only the total volume:
Furthermore, this chart has its own candles, the width of which can be adjusted accordingly.
Volume Profile
This Footprint Chart offers a Stacked Volume Profile and an Unstacked Volume Profile, the former renders a Volume Profile which compares the buys from the sells, the better to visualise levels of activity, the latter renders a standard Volume Profile which shows the total volume that transacted on a price tick.
The type of Volume Profile that this Footprint Chart renders is similar to that of a Periodic Volume Profile, which renders Volume Profiles for every bar on the chart. Furthermore, the width of each Volume Profile bar of this Footprint Chart is relative to the largest volume transacted on the current session, the session beginning from the point you have opened the Footprint Chart until the 500th bar, capped for optimisational purposes, and shall adjust the session start accordingly once this limit had been reached. The Volume Profile bars' width will therefore change agreeably to each significant volume update, and sized relatively with that of the others.
Optimisation
This Footprint Chart utilises several drawings and calculations for attaining its visuals, the arrangement of which makes it more pleasing and easier to understand. Several optimisations have been implemented within the code, e.g. utilising queues, however, if you wish for it to be even more optimised, you can use an "Unstacked" Volume Profile, using larger tick sizes, as well as using 0 decimal placements for the Footprint Chart.
Furthermore, deselecting "Use Stacked Bars" will allow more boxes to be drawn, and will double the amount of boxes the volume profile can use.
Limitations
No historical tick data have yet been made available for use and so this Footprint Chart only has realtime data at its disposal. Historical footprints are therefore not rendered, the boundary of which is delineated by a vertical broken line.
Tips
This Footprint Chart is best viewed on a chart of its own, and it is therefore ideal to clear the chart of other candles by hiding them or utilising a line chart alternatively . In addition, stretch the time scale to its utmost capacity, the better to see properly the Volume Profile, as well as stretch the price scale to a proper height, the better to read the footprint volumes inscribed on the indicator.
Warnings
Changing settings may cause the Footprint Chart to reset. If, in case you have been accumulating Footprint Charts and wish to change some settings for the benefit of your charting, it is best to take a snapshot of your chart prior, for recent changes may cause resets to occur.
Average Volume ProfileAverage Volume Profile is an abstract based on a user suggestion.
The information displayed could be summed up as a volume profile divided by a market profile.
This indicator is a profile which displays the average volume of an area (of price).
It also calculates and displays the highest average volume point (HAV) and the relating value zones (calculated in the similar fashion to a volume profile).
Most of the code is directly from my "Volume/Market Profile" Indicator
I am not entirely sure of how to make use of the information displayed in this indicator or how useful it is.
However, I have added some things I figured would be useful to comprehend this information, such as:
- Read-out for highest average volume
- Read-out for current price average volume
- Read-out for current candle distributed volume (labeled as: "Vol")
- Floating line to visualize the current distributed volume in relation to the rest of the profile.
- Color changing labels for when the current distributed volume is higher than the current price avg volume.
Enjoy!